Making an Infographic on Google Drawing Tutorial
Learn To Design Infographics With These 2 Google Tools
Use these design tools to maximize your writing productivity.
![]()
Writing demands a lot of time and focus. But sometimes, we generally want some infographics of the information we write about as well. Then we usually obsess how we can create them. As most writers might not possess design skills, or they won't have any premium subscriptions to most software. In all honesty, you don't need either one to pull this off.
A post with an infographic that shows comparisons and information diagrammatically helps save time for the reader. It is another significant measure of displaying complex subject matter in easy visual aids that the readers can follow and understand.
Creating infographics can be a stressful task if done from scratch. Thus these 2 google tools have got you covered there. Google Drawings and Google Sheets are two google tools that are known for seamlessly working together when it comes to creating diagrams and infographics.
They are excellent tools when it comes to saving time for the creator. You can easily import the finished designs as well into your drafts. They can be downloaded in many picture formats such as PNG, JPEG, and SVG to name a few.
How To Use Google Drawings
First of all, go to google drawings and click on new → Drawing. You can choose from a template or other document types as well. We will click on the drawing option for this guide.

Set the document title that you prefer, then click start editing.

Now your canvas opens up where you will add your graphics.

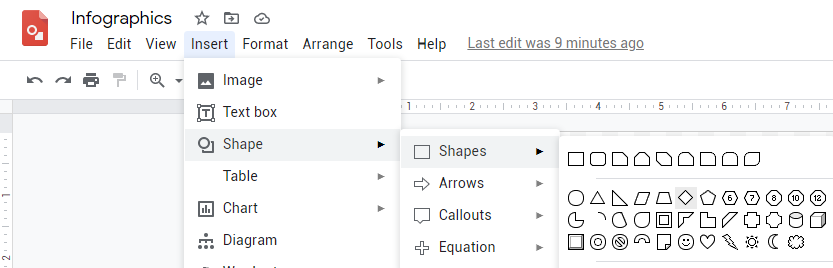
Step1: Select Insert, and options will pop up.

Here you can see a set of options that you can use to create exclusive infographics from scratch and even using templates.
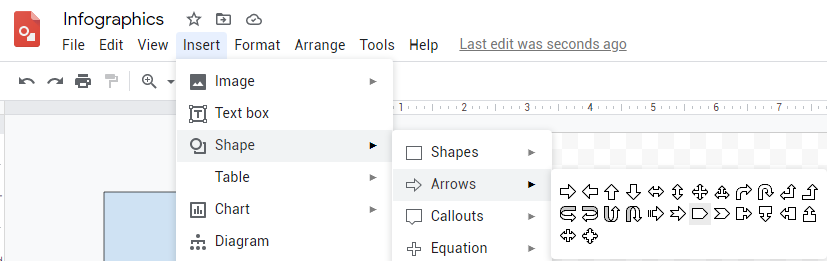
Step 2: Select shapes, sub-options will pop up.
Step 3: Drag and adjust the shapes onto the canvas.
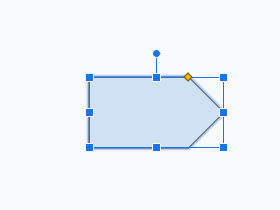
Step 3.5: Now we adjust other shapes as well by choosing the pentagon from the arrows option. so that we gain a specific shape for our infographic.
Here is an example of how you can set using the left-right arrow shapes in the arrows option.

Step 4: Click Text box to set text into or along with the shapes.

Final Result: Now we can keep on choosing our desired steps until we reach the following illustration.

This is a basic infographic of how we can create one in google drawings using love and zest.
Word Art
There are many exciting graphics that you can make using your creativity such as Word Art as follows.
Step 1: Click on insert and then navigate to word art.

Step 2: A pop-up window will open, write anything, and press enter.

Step 3: A word art will show up, now you can set the size and font type from the above option and viola.

The final result is as follows: Font Type: Lobster & Pacifico

How To Use Google Drawings + Google Sheets
Creating charts has never been so much simpler. It can be done in five simple steps as follows using these two tools.
Step 1: Click Insert and then navigate to charts, and choose the type of chart you want to create.

Step 2: For this example, I will choose a Pie Chart.

Step 3: Now we can edit our chart, a quick hack to do that the easy way is

Step 4: Click on open source, it will lead to google sheets where you can change the data types add more or delete them as well to update the chart.

Step 5: Now Hover to the new tab that is opened up where it will show a table and also another pie chart that will auto-update whenever you change a value.

Now you can add or delete teams and also set the percentages as well. One example is as follows.

As you can see the adjusted values can auto-update in the chart as well as the chart that is opened in the google drawings tab.
The Final Result
You can download the chart in any preferred picture format. Furthermore, you can import your chart into google sheets and create a presentation with your infographic as well. Click here to learn more.

Conclusion
There are many other exciting examples as long as you have an idea in mind. You can make it in google drawings. Plus the pleasure that comes from making something so spiffy is certainly an achievement. Thus if you followed along and made it here with your awesome graphics.

Have an awesome time using these exciting tools in creating infographics. Before we finish this, here's something that you can do more with google drawings.
Extras
Applause is necessary when you finish a tutorial, let's create an applause infographic for ourselves using this amazing hack.
This is an exemplary Hack towards importing images from the web and then using them as templates by exploring google drawing's toolkits.
Step 1: First of all we should import and search from google.

Step 2: let's search the web for applause. then navigate to choose our preferred image and then click insert.

Step 3: The image will be inserted into the canvas, and then click on it to open options and then click format options.

Step 4: Now you can have even more options than before that you can choose to adjust recolor, even reflect images as well. Now your creative spirit will be essential towards creating exciting infographics.

Step 5: You can choose your desired colors, you can even set the background color to transparent as well. It all depends on your preference.

Step 6: You can add as many images to create your creative stories in infographics, adjust them accordingly as the following illustration.
The following infographic represents that anyone can become a professional infographic designer.
It doesn't matter where you come from — it all depends on your willingness to learn and adapt. Anyone can become one with zest.

It all comes down to what you want to create, with little effort, persistence, and vesting some time — you can create your awesome infographics within a few minutes.
Have Fun Drawing and Designing Your Infographics. You can do it. Peace.
Thank you for reading. Stay Blessed and Stay Safe!
Making an Infographic on Google Drawing Tutorial
Source: https://medium.com/illumination/a-quick-hack-for-generating-awesome-infographics-with-these-2-google-tools-5c3c2c500220